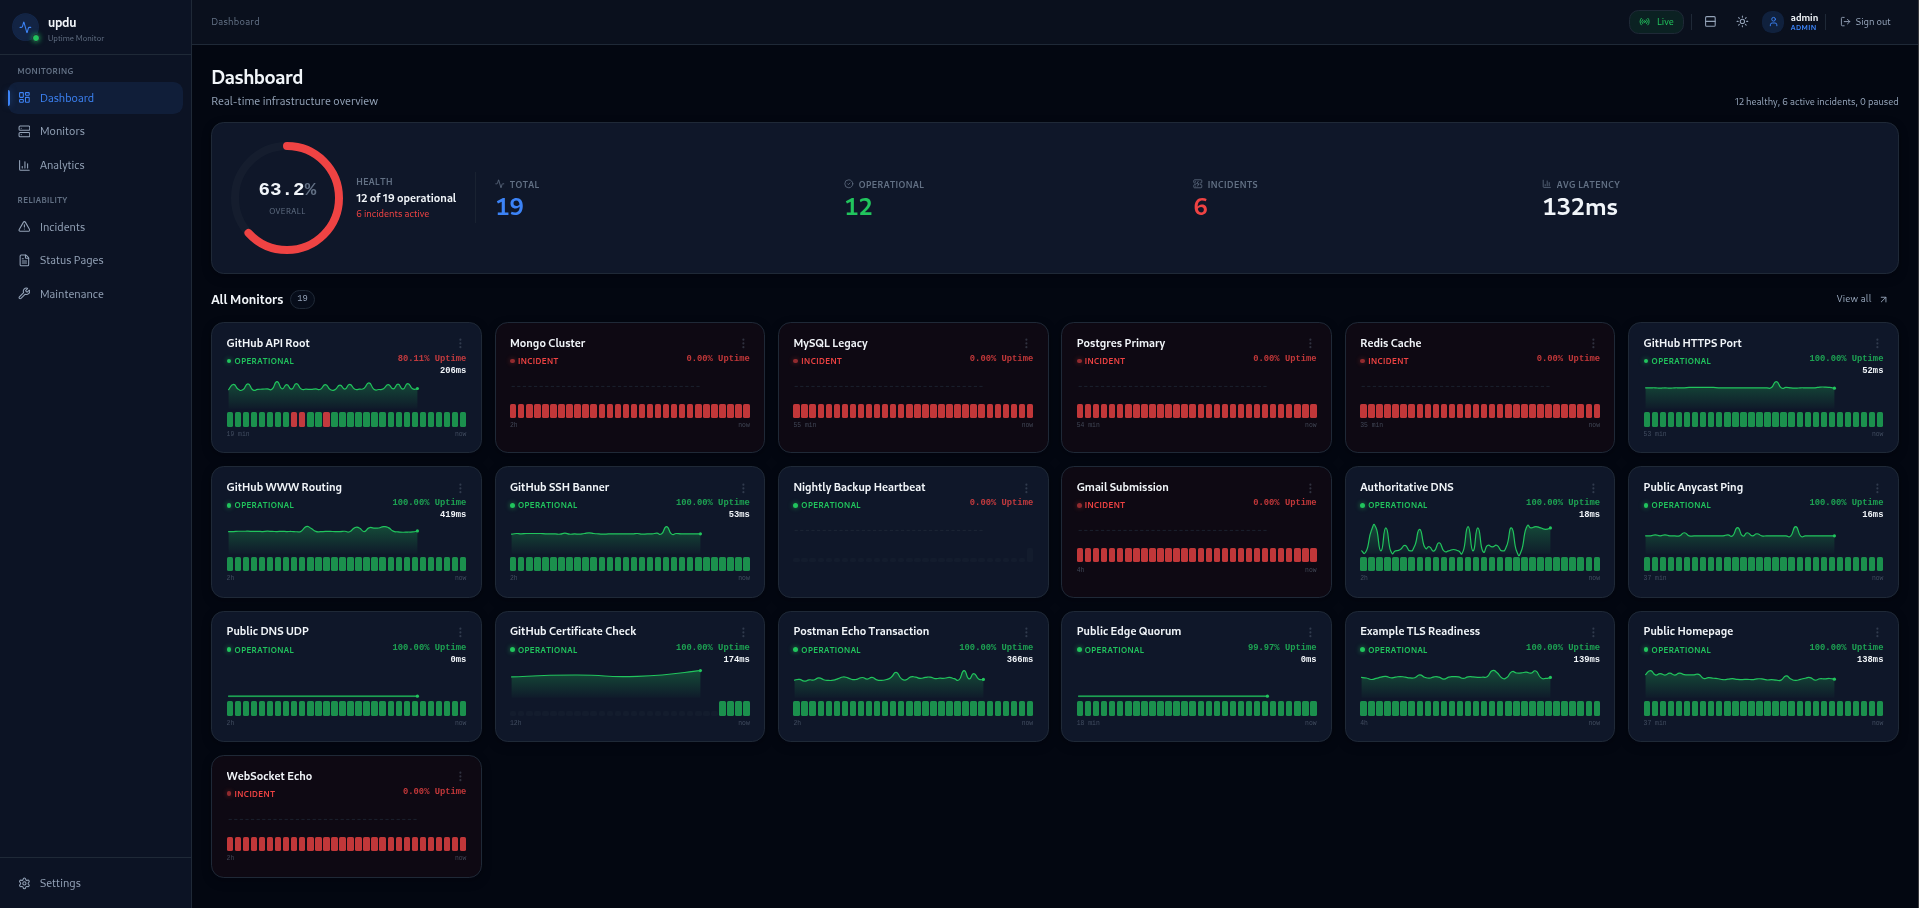
Open Source · Self-Hosted

Uptime monitoring
that runs anywhere

A single ~16MB binary that monitors your entire infrastructure. Designed to run on a Raspberry Pi Zero W — fast enough for everything else.

~0MB
ARM binary
0 checks
Monitor types
0 channels
Notification channels
0 deps
External dependencies
0 binary
To deploy
Monitor Everything

15 ways to watch your stack

From HTTP endpoints and databases to passive Heartbeats, updu checks the things that matter — and alerts you when they don't respond.

HTTP / HTTPS

Monitor web endpoints with configurable expected status codes, response time thresholds, and keyword matching in response bodies.

TCP Port

Verify that services are accepting connections on specific ports. Catch firewall misconfigurations and service crashes instantly.

DNS

Validate DNS records resolve correctly. Detect hijacking, propagation delays, and misconfigured zones before users notice.

ICMP / Ping

Low-level reachability checks for hosts and network devices. Know immediately when a server goes dark.

SSH

Verify SSH connectivity to remote machines. Make sure your management plane stays reachable at all times.

SSL Certificate

Track certificate expiry dates and get warned before they lapse. No more surprise expired-cert outages.

JSON API & Websockets

Deep-check API responses by validating JSON fields and values. Verify WebSocket and WSS connection upgrades.

Databases & Mail

Ping Redis, PostgreSQL, MySQL or MongoDB instances. Verify SMTP and UDP ports are open and responding.

Push (Heartbeat)

Passive monitoring endpoint for cron jobs and external scripts to ping when they finish running.

Ridiculously Lightweight

Born on a Raspberry Pi Zero W

updu was purpose-built to run on the smallest hardware. A single Go binary with an embedded SvelteKit frontend and SQLite database — no Node.js runtime, no external database, no containers required.

~0MB
ARM v6 binary
0
External dependencies
0
File to deploy
512MB
Min RAM (Pi Zero W)

Runs on a Pi Zero W

512MB RAM · 1GHz single-core · $10 board

updu (ARM v6) ~16 MB
Uptime Kuma ~300 MB+
Grafana + Prometheus ~800 MB+
Datadog Agent ~750 MB+
Built for Homelabs

Everything in one binary

No microservices. No sidecars. Just one file that does the job.

Single Binary

Go compiles to a single static executable. Drop it on any host and run. No runtime, no package manager, no fuss.

Embedded UI

The SvelteKit frontend is compiled and embedded directly inside the Go binary using go:embed. One file serves everything.

SQLite Storage

No Postgres, no MySQL, no Redis. Data lives in a single SQLite file alongside the binary. Backup is just a file copy.

Real-time SSE

Server-Sent Events push monitor status updates to the dashboard instantly. No polling, no WebSocket complexity.

5 Notification Channels

Get alerted via Webhook, Discord, Slack, Email (SMTP), or Ntfy. Route notifications per monitor and integrate with any workflow.

OIDC / SSO

Optional OIDC integration for single sign-on via a Go build tag. The default binary ships without OIDC code entirely — no unused auth libraries, no extra endpoints, reducing your attack surface where SSO isn't needed.

Public Status Pages

Share beautiful, public-facing status pages with custom slugs, grouped monitors, and optional custom CSS. Select exactly which monitors appear on each page.

Docker Ready

Official multi-arch Docker image. One docker run command and you're monitoring. Works on ARM and x86.

GitOps

Declarative YAML configuration with deterministic IDs (SHA256 of name+type). Drop a .updu.conf file and monitors sync on startup — idempotent and version-controllable.

Self-Update

One-click updates from GitHub Releases with automatic checksum verification. Stay current without manual downloads or redeployments.

Prometheus Metrics

GET /api/v1/metrics exposes monitor counts, runtime stats, incident gauges, and GC metrics. Plug directly into your existing Prometheus + Grafana stack.

Incident Management

Track incidents with severity levels, status progression (investigating → identified → resolved), and per-monitor history. Keep your team informed through every stage.

Maintenance Windows

Schedule planned maintenance to suppress alerts and pause checks. Avoid false positives during deployments, upgrades, and planned downtime.

Backup & Export

Export your entire configuration as JSON or GitOps-ready YAML. Import backups to restore or clone your setup across instances.

Operations

Built to scale on minimal hardware

SQLite-backed by design, with clear tuning knobs when you need to push further.

SQLite Tuning

WAL journal mode, NORMAL synchronous, 5s busy timeout, and single-writer serialization. Tuned for low-resource ARM devices out of the box.

Capacity Guide

  • 1–50 monitors — comfortable on any hardware
  • 50–200 monitors — fine on Pi 4 / any VPS
  • 200–500 monitors — increase intervals to 60s
  • 500+ — consider SSD + mmap + longer intervals

Data Retention

Raw check results are purged after 30 days. 5-minute aggregates are retained indefinitely (~288 rows/monitor/day). Database stays compact even at scale.

Health & Observability

GET /healthz returns DB, scheduler, and SSE status (use for Docker, K8s, or load balancer probes). Prometheus metrics at /api/v1/metrics for full visibility.

Worker Pool

Concurrent check workers auto-scale to CPU×4 (clamped 4–50). Jitter, stagger, and retry logic prevent thundering-herd write bursts on SQLite.

Tuning Knobs

  • UPDU_WORKER_POOL_SIZE — concurrent workers
  • UPDU_MIN_INTERVAL_S — min check interval
  • UPDU_ALLOW_LOCALHOST — target localhost
  • UPDU_ENABLE_CUSTOM_CSS — status page CSS

Read the full Scaling Guide →

Get Started

Up and running in 30 seconds

Choose your preferred installation method.

# Pull and run updu
docker run -d \
  --name updu \
  -p 3000:3000 \
  -v updu_data:/data \
  ghcr.io/nwpeckham88/updu:latest
# docker-compose.yml
services:
  updu:
    image: ghcr.io/nwpeckham88/updu:latest
    ports:
      - "3000:3000"
    volumes:
      - updu_data:/data
    restart: unless-stopped

volumes:
  updu_data:
Include OIDC / SSO support (adds ~2 MB — omit to reduce attack surface)
# 1. Download for your architecture
curl -LO https://github.com/nwpeckham88/updu/releases/latest/download/updu-linux-amd64

# 2. Make executable and run
chmod +x updu-linux-amd64
./updu-linux-amd64

Open localhost:3000 and create your first monitor. That's it.